2015 Investing Themes

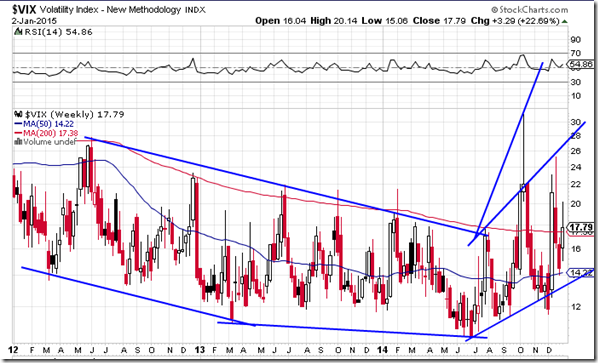
  • Volatility trending up: the downard trend of volatility ended in July 2014, and volatility started trending up with higher lows and higher highs. Furthermore, VIX broke important threshold of 24 in Oct 2014. This indicates the consensus bull market has ended, and the opinions of market participants started diverging. Since the bull market has run a long time, it probably won’t ends abruptly. It’ll likely get higher but with much high volatility. As a result, stay away short volitilty ETFs such as SVXY and XIV. Instead, use leverage SPX ETFs such as SSO, UPRO, or ES wisely around market lows. May try VXX around VIX trend channel supports provided contango is not sigificant.
  • Potential fundamental triggers for high volatility:
    • Sharp drop of oil and commodity prices. High volatility in oil prices
    • Europe debt crisis (Greek)
    • Sharpt currency devaluation

image 

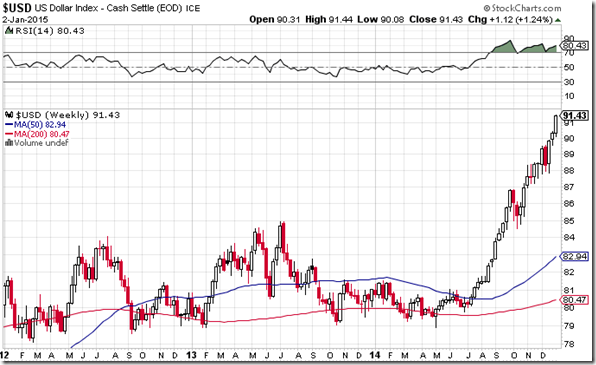
Strong dollar:

image

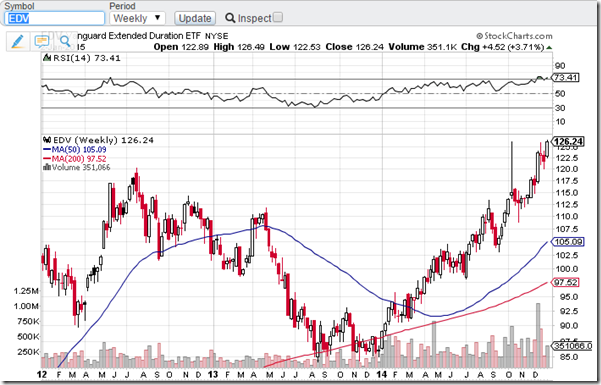
Strong Equity and Bond Market for US

image

Low Oil and Commodity Prices

Is it wise to catch the falling knife in oil/commodity price drop? The down turn could be long-term (over 10 years) because of strong dollar cycle.

Posted in Uncategorized | 1 Comment

Expiration Day Effect on VXX Daily Return

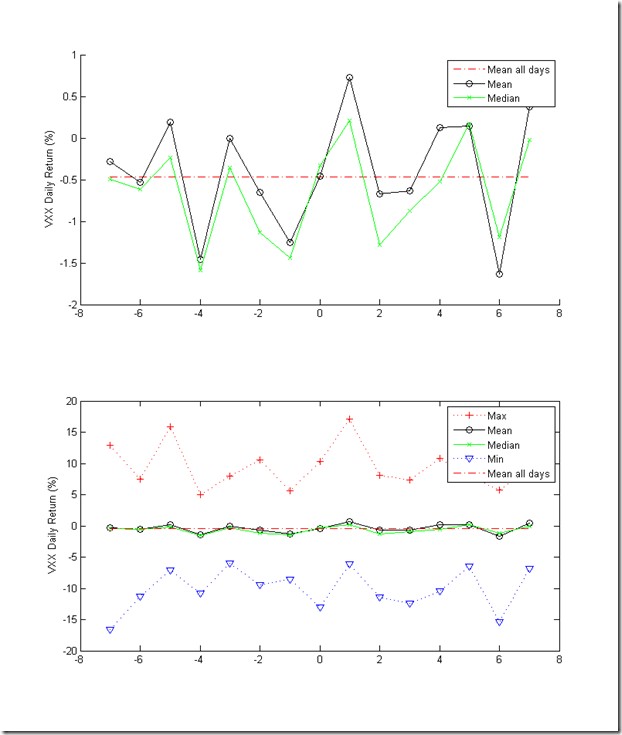
I’ve been wondering if the Vix future dates have any effect on the VXX daily return. I thought VXX probably drops more on the expiration day. So I calculated  the average VXX daily return since inception and daily returns as a function of days to expiration. The results are as follows:

The average daily return for VXX as of 1/31/2014 is –0.4684%.

To my surprise, the return on the expiration day (x=0 on the chart) is almost the same as the average returns for all days. However, the return on the day before the expiration (Tuesday) is much lower and the day after the expiration (Thursday) is much higher than average.  Furthermore the returns on the Thursdays before (x=-4) and after (x=+6) the expiration week are significantly lower than average.

image

Posted in Uncategorized | Leave a comment

Natural Gas Spikes and SPX Bull/Bear Markets

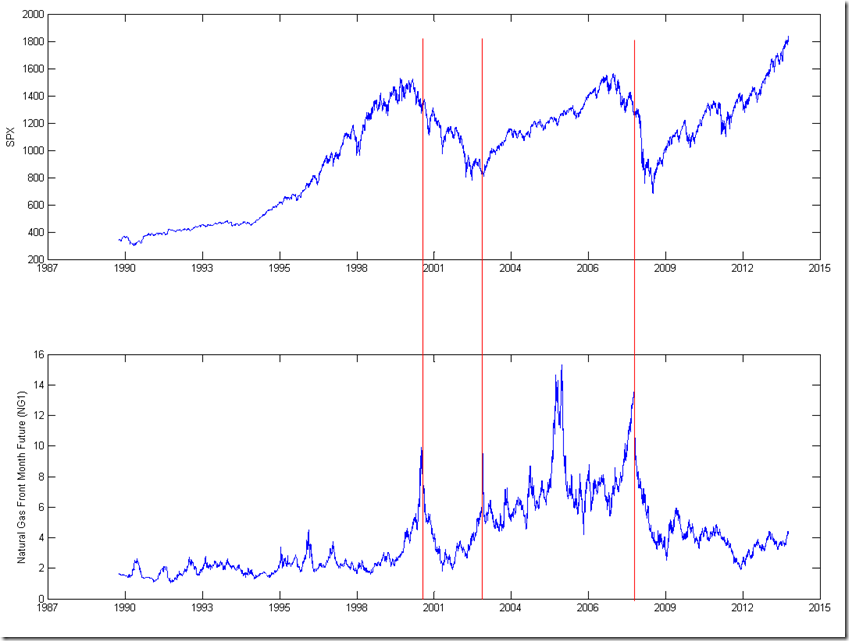
The following figure shows SPX and natural gas future prices since 1990. Three spikes in natural gas prices indicated important market changes. It seems that natural gas is a leading indicator of SPX prices.

  1. NG1 peak in Dec 2000 signaled the ending of decade long bull market and the beginning of a bear market
  2. NG1 peak in March 2003 signaled the ending of bear market
  3. NG1 Peak in July 2008 preceded the large precipitous SPX drop in late Sept and early Oct 20008.

Further study:

  • Spikes between Oct-Dec 2005 and other smaller spikes
  • VIX and NG1
  • Inter-market analysis of SPX, VIX, NG1, Crude Oil and other commodities with a focus on extreme values

image

Posted in Uncategorized | Leave a comment

Surprise! Future is not Looking Forward!

VIX futures are supposed to reflect people’s expectation of  VIX prices into the future, aka, looking forward. However, how do people make predictions? Most people look back into the past to predict the future.

For example, what should be the VIX price in one month? People look back into the past and see what have happened in a month under similar conditions. As a result, the magnitude and frequency of past VIX spikes will significantly affect people’s expectation because people’s behaviors are greatly affected by traumatic events.

The most recent past usually has more impact because people tends to have short memories. One simple way to estimate 1 month future price is to just calculate the average of VIX prices in the past month. However, we know events in more distant past do affect people’s expectation. Particularly, VIX futures are usually used as hedge or tail events.

Posted in Uncategorized | Leave a comment

What are the Implications of VIX Term structure and Rolling Yield on Portfolio Hedge

VIX futures are often used to hedge equity portfolios because they have negative correlations. In order to get continuous hedge, one needs to roll the front expiring futures to back month futures. What are the cost of such hedge?

If VIX futures are in contango, which is the case most of the time. To maintain the amount of hedge (or hold the same number of contracts), one needs to pay rolling cost because one sells cheaper front futures and buys more expensive back futures. It’s like one pays premium to buy insurance over house and cars.

Imagine VIX futures are the same for all near and long-term futures, there’s no extra cost rolling from near-term to long-term futures. This means one can get free hedge. That’s unlikely to happen. After all, there’s no free lunch.

If VIX futures are in backwardation, which usually happens in extreme volatile period. Future rolling can actually generate profit if one only needs to maintain the same amount of future contracts. This basically says you’re paying too much premium for hedge at this extremely volatile moment. Your premium will be lower in the future. This doesn’t happen often. After all, nobody wants to overpay car insurance premium under normal conditions except right after some accidents. People make emotional decision under the control of fear.

Posted in Uncategorized | Leave a comment

The Real Culprit of VXX’s Abysmal Performance

The following chart shows the VXX price and the number of underlying future contracts. This shows the primary factor affecting VXX price change is the underlying contracts. Over a long period, VIX is range bound and its changes become almost negligible compared to the volume change of the underlying contracts.

Due to continuous rolling , a portion of front month contracts (roughly 5%) is sold and the proceeds are used to buy second month contracts. If second month contract is more expensive, which is the case over 80% of the time, the number of contracts are reduced in the rolling process. Over a long period, this rolling cost can be huge. The starting number of contracts was 100 in 2004, it decreases to about 1.0 in Nov 2013. That’s 99% drop in 10 years!

image

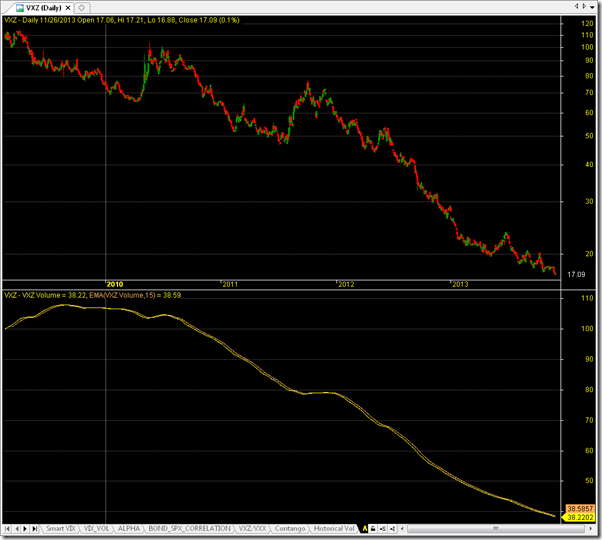
Similarly, the following chart shows VXZ price and the number of underlying future contracts.

image

Posted in Uncategorized | Leave a comment

SPX and Realized Volatility (1950-2013)

image

Posted in Uncategorized | Leave a comment

VIX Regime Switch and the Big Picture

Most of the automated strategies only work well under certain market conditions. For example, many of the VIX future contango trend following strategies worked well 2009 through 2012, during which VIX was in a high range while trending downward. However, these same strategies has been performing poorly since 2013, during which VIX is in a low range and relatively flat.

It also seems that market conditions constantly change and cause almost no strategies work all the time. As a result, it’s important to know what market condition we are in and choose the appropriate strategies. In other words, what’s the big picture? In the long-term time frame in terms of years or even decades, are we in a bull or bear market? High or low volatility regime? Is the market or volatility trending downward or up?

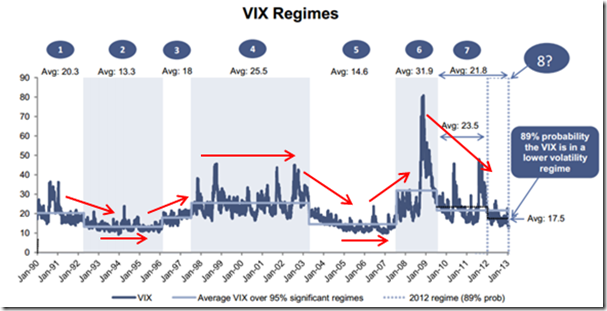
According to a GS report, there have been 8 regimes since 1990 (see the following figure). The longest regime (regime 4) lasted almost 6 years (Jul-97 – Apr 03), while the shorted (regime 3) lasted about one and half year (Feb, 96-Jul, 97). The latest ongoing regime 8 started in Jan 13. In general, the market has been switching between high and low volatility regimes.

The following observations can be made from the VIX and SPY regimes. Note low volatility means VIX < 24.

  • Bear markets always have high volatility.
  • Bull markets can have either low or high volatility.
  • It’s always a bull market in low volatility regimes, no matter the VIX is trending down or up. For example, it’s bull market during low volatility regimes 2 (vix trending down), 3 (vix trending up) and 4 (vix trending down).
  • It can be either bull market or bear market during high volatility regimes. Moreover, high volatility can occur either at the early or late stages of bull markets, for example 97-2000 high volatility was the late stage of the decade long bull market, while 09-12 was the early stage of a bull market.
  • Low volatility doesn’t occur at the late stage of bull markets.

We’re currently in a extremely low volatility regime. From the above observations, we should be in the late stage of bull market even though the current bull market has lasted for 4 years. We’re probably in the middle stage of bull market. Furthermore, the VIX is just trending down, we’re probably in the early middle stage of bull market. That means it’ll probably be years before the current bull market ends. Specifically, we may see the following possible scenarios in the coming years:

  1. Low volatility bull market while VIX bottoms out (1-3 years)
  2. Low volatility bull market while VIX trending up (1-2) years)
  3. Possible high volatility bull market. Actually this can be very likely if the first two predictions turn out to be true because it would be a extremely long bull market at that time it probably won’t ends easily. So it’ll probably go through a high volatility period before the market turns into a bear market.
  4. Bear market.

Based on the above predictions, there will be good opportunities of VIX based investments. We should be more aggressive in investing. At least get fully invested!
image

image

image

Posted in Uncategorized | 2 Comments

VIX Big Picture, Regime Switch, and Cyclic Behavior

How to describe VIX trend?

VIX Trend and The Significance of VIX Peaks (and Troughs?)

VIX range

Description of SPY and VIX regimes

Posted in Uncategorized | Leave a comment

The Longest Period during Which VIX is below a Specific Level

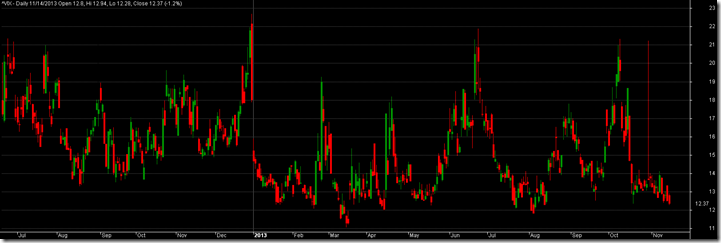
The VIX is very low this year with only sporadic/periodic spikes to low 20s. This give a big boost to XIV (up 75% YTD) while VXX is bleed to death (down 60% YTD). image

However, due to those sporadic spikes, almost all of my strategies haven’t performed well. In this low VIX environment, the trend following strategies tend  to sell at the best buying opportunities. It seems a buy and hold approach will outperform most strategies. I observed that although VIX spikes periodically, the maximum peak doesn’t exceed 24. If this pattern holds for a long time, say a few years , buying and holding XIV will do very well. This motivated me to crunch the data to find out what’s the longest period during which VIX is below a specific level in a row.

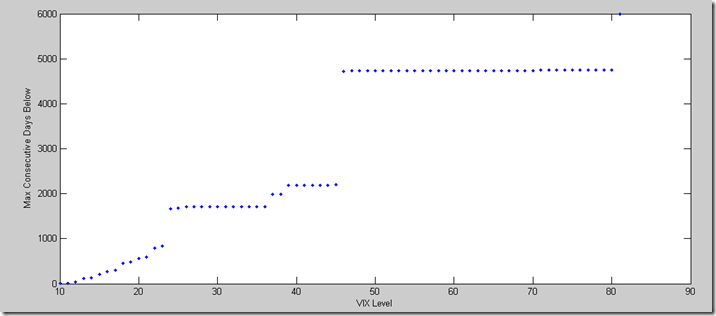
The results are shown in the following chart and table. It turns out the 24 is actually a significant level for VIX. There’s a big jump (doubled) from 832 to 1658 days during which VIX is below 23 and 24, respectively. I can imagine XIV will probably go to the roof during such period because VIX futures will be in contango most of the time in this low price range. It may be a good idea to just buying and holding XIV as long as VIX is below 24. 

This is also a similar jump (more than doubled) from 2197 to 4725 days when VIX level is changed from 45 to 46, which indicates 46 is a significant resistance for VIX.

It’s also surprising to see that how long VIX can be a below a level in a row. For example it can be under 13 for 115 days in a row, that’s almost half a year. The average Contango is probably about 9% / month at such low level. That means XIV will probably gain about 50% from roll yield only during such a period.

Also note that VIX can be below 24 for 1658 days in a row, that’s about 7 years in a row. I can imagine that holding XIV for the whole period will sure do extremely well.

It seems we can also assume that it’s a bull market if VIX is consistently below 24. In such market conditions, mean-reversion out-performs trend-following strategies. An idea is to buy into XIV whenever VIX spikes and sell XIV when VIX is in the bottom range. This basically confirms the idea I posted at https://yimapo.wordpress.com/2013/10/08/no-bear-market-vix-20/

image


VIX Level Max Days Below
10 4
11 10
12 37
13 115
14 133
15 205
16 273
17 297
18 447
19 487
20 558
21 594
22 785
23 832
24 1658
25 1675
26 1713
27 1713
28 1714
29 1714
30 1714
31 1714
32 1716
33 1716
34 1718
35 1718
36 1718
37 1981
38 1981
39 2189
40 2190
41 2190
42 2190
43 2190
44 2190
45 2197
46 4725
47 4730
48 4730
49 4730
50 4730
51 4730
52 4730
53 4731
54 4732
55 4732
56 4732
57 4732
58 4733
59 4733
60 4733
61 4733
62 4733
63 4733
64 4734
65 4734
66 4734
67 4734
68 4734
69 4734
70 4739
71 4744
72 4744
73 4744
74 4744
75 4744
76 4744
77 4744
78 4744
79 4744
80 4745
81 5989
Posted in Uncategorized | Leave a comment